前言
事情的起因看到了下面这位大佬的博客,觉的很好看,就想着在自己的归档页面也实现一个热力图的组件。

在 GitHub 也找到了类似的开源项目——hexo-graph,效果如下图:
巧合的是,这位佬使用的主题还是和我一样的,但是我并没有在他的主题仓库里找到相关的代码……遂放弃,还是想着自己写一个。
技术栈
- ECharts:百度开源的数据可视化图表库
- JavaScript:实现热力图的核心逻辑
- CSS:样式调整和主题适配
实现思路
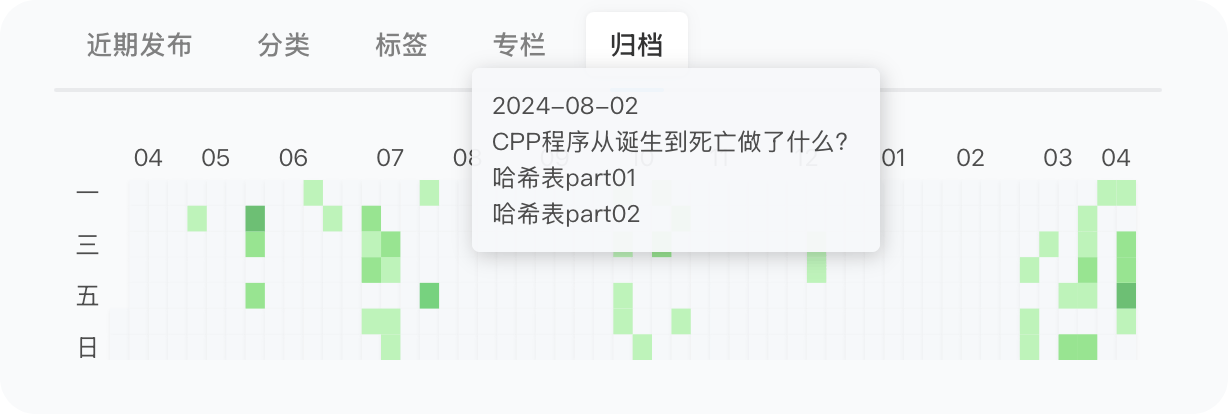
最终实现的效果如图
具体的实现代码可以参考仓库的提交源码:feat: 添加热力图功能及相关样式
- 在配置文件中添加ECharts和热力图服务的链接。
- 在归档页面中集成热力图展示,显示文章发布情况。
- 新增热力图生成器,提供API接口返回文章数据。
- 添加热力图的样式,优化展示效果。
1. 容器初始化
首先,我们需要创建一个容器来承载热力图。通过 JavaScript 动态创建 DOM 元素,并设置基本样式:
1
2
3
4
5
| const chartDom = document.createElement('div');
chartDom.style.cssText = 'height:110px;margin:1rem 0;padding:0.5rem;';
el.appendChild(chartDom);
const myChart = echarts.init(chartDom);
|
2. 数据处理
热力图的数据来源是博客文章的发布日期。我们需要将文章数据转换为热力图所需的格式:
1
2
3
4
5
6
7
8
9
10
11
12
13
14
15
16
17
18
19
20
21
| const dataMap = new Map();
posts.forEach(function(post) {
const date = new Date(post.date);
const key = date.getFullYear() + '-' +
String(date.getMonth() + 1).padStart(2, '0') + '-' +
String(date.getDate()).padStart(2, '0');
const value = dataMap.get(key);
if (value == null) {
dataMap.set(key, [{
link: post.url,
title: post.title
}]);
} else {
value.push({
link: post.url,
title: post.title
});
}
});
|
3. 主题配置
为了适应博客的明暗主题,我们定义了两套颜色方案:
1
2
3
4
5
6
7
8
9
10
11
12
13
14
| const themes = {
light: {
backgroundColor: 'rgba(246, 248, 250, 0.95)',
blockColor: '#f6f8fa',
highlightColor: ['#f6f8fa', '#aff5b4', '#7ee787', '#4ac26b', '#2da44e'],
textColor: style.getPropertyValue('--text-p2').trim() || '#999'
},
dark: {
backgroundColor: 'rgba(22, 27, 34, 0.95)',
blockColor: '#161b22',
highlightColor: ['#161b22', '#0e4429', '#006d32', '#26a641', '#39d353'],
textColor: style.getPropertyValue('--text-p2').trim() || '#666'
}
};
|
4. ECharts 配置
热力图的核心配置包括:
1
2
3
4
5
6
7
8
9
10
11
12
13
14
15
16
17
18
19
20
21
22
23
| const option = {
tooltip: {
hideDelay: 1000,
enterable: true,
backgroundColor: currentTheme.backgroundColor,
formatter: function (p) {
}
},
calendar: {
cellSize: [13, 13],
range: [formatDate(startDate), formatDate(endDate)],
itemStyle: {
borderRadius: 2,
shadowBlur: 2
}
},
series: {
type: 'heatmap',
coordinateSystem: 'calendar',
data: data
}
};
|
开发过程中遇到的问题
1. 主题切换适配
问题:在切换博客主题时,热力图的颜色方案没有及时更新。
解决方案:使用 MutationObserver 监听主题变化,动态更新配置:
1
2
3
4
5
6
7
8
9
10
11
12
13
14
15
| const observer = new MutationObserver((mutations) => {
mutations.forEach((mutation) => {
if (mutation.attributeName === 'data-theme') {
const isDark = document.documentElement.getAttribute('data-theme') === 'dark';
const theme = isDark ? themes.dark : themes.light;
option.tooltip.backgroundColor = theme.backgroundColor;
option.visualMap.inRange.color = theme.highlightColor;
myChart.setOption(option);
}
});
});
|
2. 提示框样式重叠
问题:热力图提示框与底部内容重叠,影响可读性。
解决方案:
- 调整提示框背景色的透明度
- 增加提示框的显示延迟
- 优化提示框的内容布局
1
2
3
4
5
6
7
8
| tooltip: {
hideDelay: 1000,
backgroundColor: 'rgba(246, 248, 250, 0.95)',
padding: [10, 15],
textStyle: {
fontSize: 12
}
}
|
3. 响应式适配
问题:在窗口大小变化时,热力图没有自适应调整。
解决方案:添加窗口resize事件监听:
1
| window.addEventListener('resize', () => myChart.resize());
|
参考资料
- ECharts 官方文档
- GitHub Contributions 图表设计